When IPv6 routing goes wrong
I have been using VPS from Linode for more than 10 years, located in several locations world-wide, and except from Network maintenance or seldom DDOS attacks, I have never experienced any direct networking issue. Until last month, when I ran into an interesting routing issue between two VMs located in two data centres: Tokyo, Japan and London, UK.
It all started on February 23rd with alerts from a micro-service used to synchronise the data between a server in Tokyo and another one in London. After a quick investigation, it became clear that the issue was related to an abnormal network latency when connecting to the HTTPs API endpoint on the London server from the Tokyo service: the HTTP connection could be established, but getting the result from the API, which would usually take 100ms, would then take more than 30 seconds.
Micro-service connectivity
Looking further at the Rest API micro-service logs from the London-based server did not give more clue, so the natural next step was to check the connectivity from the Tokyo server down to the London server. A simple curl -vvv gave all the needed information
# curl "http://xxx.members.linode.com/service/sync" -vvv
* About to connect() to xxx.members.linode.com port 80 (#0)
*   Trying 2a01:7e00::1234:5678:9abc:def0...
* Connected to xxx.members.linode.com (2a01:7e00::1234:5678:9abc:def0) port 80 (#0)
* Connection timed out
*   Trying 139.123.123.123...
* Connected to xxx.members.linode.com (139.123.123.123) port 80 (#0)
> GET /service/sync HTTP/1.1
> User-Agent: curl/a.b.c
> Host: xxx.members.linode.com
...
What became clear is that, since the London server had both IPv4 and IPv6 advertised on the DNS, the curl command tried both IPv4 and IPv6, starting with IPv6. Where it went wrong is that the IPv6 connection failed, and only after a 30 seconds curl defaulted back to IPv4. Fortunately, the IPv4 connection worked fine, and the micro-service did provide the correct API result - excluding an issue from the micro-service
As an immediate action to keep the system running, the curl (fetch) command was first updated to enforce IPv4 use, and then the AAA entry from the DNS was remove.
That worked fine, yet, that did not explain why the IPv6 connectivity failed, especially since there was not system update on any of the servers for the past 7 days. I then decided to run a few more test to find out the root cause, and make sure that this situation would not happen again.
Understanding connectivity
Layer 3 Connectivity - aka IP(v6)
When it comes to checking the network connectivity between two servers, the common approach is to use ping and trace-route. Somewhat, those are effective tools, but slightly outdated in 2022. Nowadays, a better tool, which combines both ping and trace route, as well as many more features is MTR, aka Multi Trace Route.
mtr -6rwbzc 100  2a01:7e00::f03c:....
Start: Fri Feb 25 11:19:39 2022
HOST: Tokyo                Loss%   Snt   Last   Avg  Best  Wrst StDev
  1. 2400:8902::4255:....   0.0%   100    1.1   1.3   0.8   8.9   1.1
  2. 2400:8902:f::1         0.0%   100    0.6   1.6   0.4  37.4   4.8
  3. 2400:8902:5::1         0.0%   100    7.6   1.4   0.4  26.3   3.4
  4. 2001:678:34c:6c::1     0.0%   100  103.5 104.2 103.0 137.7   4.7
  5. 2600:3c01:3333:5::2    0.0%   100  103.1 103.7 103.0 115.4   1.9
  6. 2001:678:34c:44::2     0.0%   100  178.9 179.7 178.8 201.0   2.9
  7. 2600:3c04:15:5::1      0.0%   100  178.9 179.4 178.8 197.8   2.4
  8. 2001:678:34c:49::2     0.0%   100  259.4 254.2 252.8 293.5   5.4
  9. 2a01:7e00:7777:18::2   0.0%   100  253.9 253.8 253.5 258.0   0.6
 10. 2a01:7e00::f03c:....   2.0%   100  252.9 253.2 252.9 262.9   1.0
The MTR result did not show anything abnormal, expect from a 2% drop on the London VM hosting the micro-service. This drop is annoying and I will come back on this issue later. But for now, it does not explain why the curl command completely failed, since with the 2% drop, the curl command would still be able to go through. In other words, only a drop close to 100% would justify why the curl command does not work.
Layer 4 Connectivity - aka TCP, UDP and ICMP.
The less know part of ping and trace-route is that they essentially work using ICMP (aka Internet Control Message Protocol), a special Layer4 protocol for checking IP connectivity. And in my case, ICMP does not represent the ground truth: The HTTPs micro-service is exposed over TCP (or UDP for QUIC/HTTP3), meaning that when connecting using CURL to the micro-service, the real protocol that need to be checked is TCP and not ICMP.
Maybe that sounds counter intuitive: If the connectivity can be established using ICMP, why couldn't it using TCP or UDP? MTR has actually a statement about this issue. But before digging further into the details of the L4 connectivity, let's have a quick look at the MTR results using UDP and TCP:
mtr -6rwbzc 100 --udp 2a01:7e00::f03c:...
HOST: Tokyo                Loss%   Snt   Last   Avg  Best  Wrst StDev
  1. 2400:8902::fa66:....   0.0%   100    0.9   1.6   0.7  22.4   2.4
     2400:8902::4255:....
  2. 2400:8902:d::1         0.0%   100   19.4   1.6   0.3  25.1   3.9
  3. 2001:678:34c:6c::1     0.0%   100    0.9  54.4   0.4 131.8  51.9
     2400:8902:5::1
  4. 2600:3c01:3333:5::2    0.0%   100  103.0 103.3 102.9 115.5   1.5
     2001:678:34c:6c::1
  5. 2001:678:34c:44::2     0.0%   100  158.7 130.8 102.9 161.2  27.8
     2600:3c01:3333:5::2
  6. 2001:678:34c:44::2     0.0%   100  158.9 159.4 158.6 175.0   1.9
     2600:3c04:15:5::1
  7. 2001:678:34c:49::2     0.0%   100  169.3 194.5 158.7 246.2  36.7
     2600:3c04:15:5::1
  8. 2a01:7e00:7777:18::2   0.0%   100  232.8 233.9 232.7 244.6   2.0
     2001:678:34c:49::2
  9. 2a01:7e00::f03c:....   0.0%   100  233.4 233.3 232.7 239.3   0.8
     2a01:7e00:7777:18::2
At first glance, the UDP MTR does not show anything abnormal, at least as far as drop is concerned. The only annoying part is that the routes do not seem to be stable, and since MTR is sorting by hop, each hop can be associated to several IPs. For instance 2a01:7e00:7777:18::2 which seems to be the Linode UK front router just before the VM can be seen on hop 8 and 9. Yet, I do not really explain why if this IP can be seen on the last hop, there is not another hop with the actual VM IP.
mtr -6rwbzc 100 --tcp 2a01:7e00::f03c:...
HOST: Tokyo                Loss%   Snt   Last   Avg  Best  Wrst StDev
  1.2400:8902::4255:....    0.0%   100    0.9   1.1   0.7   2.5   0.2
  2.2400:8902:f::1          0.0%   100    0.5   1.5   0.4  39.9   4.5
  3.2400:8902:5::1          0.0%   100  106.4  59.8   0.4 149.1  53.9
    2001:678:34c:6c::1
  4.2600:3c01:3333:5::2     0.0%   100  106.5 108.5 106.3 144.9   5.9
    2001:678:34c:6c::1
  5.2600:3c01:3333:5::2     0.0%   100  162.2 137.6 106.3 194.8  28.2
    2001:678:34c:44::2
  6.2001:678:34c:44::2      0.0%   100  162.3 162.7 162.1 179.3   1.8
    2600:3c04:15:5::1
  7.2600:3c04:15:5::1       0.0%   100  162.2 193.5 162.2 246.8  36.9
    2001:678:34c:49::2
  8.2001:678:34c:49::2      0.0%   100  236.8 237.4 236.1 251.2   2.1
    2a01:7e00:7777:18::2
  9.2a01:7e00:7777:18::2   48.0%   100  236.9 237.1 236.8 237.9   0.0
 10.???                    100.0   100    0.0   0.0   0.0   0.0   0.0
This second trace, this time using TCP, is spot on: It clearly shows a complete (100%) drop on the last IP, which is the London-based VM IP.
So, well.... ICMP and UDP working fine, but not TCP? And only for IPv6? To add on the weirdness of the situation, I checked the connectivity to the London VM from another VM located in Tokyo, and it did not show any issue. This is definitely and interesting situation worth digging out.
Layer 2 Connectivity - aka frames.
The way MTR TCP connectivity testing works is by establishing TCP sessions (aka connect) while at the same time setting the socket in non-blocking mode as well as setting the IP TTL . When the TTL is big enough, the server will respond with a SYN-ACK, while if the TTL is too low, an ICMP message will be sent back.
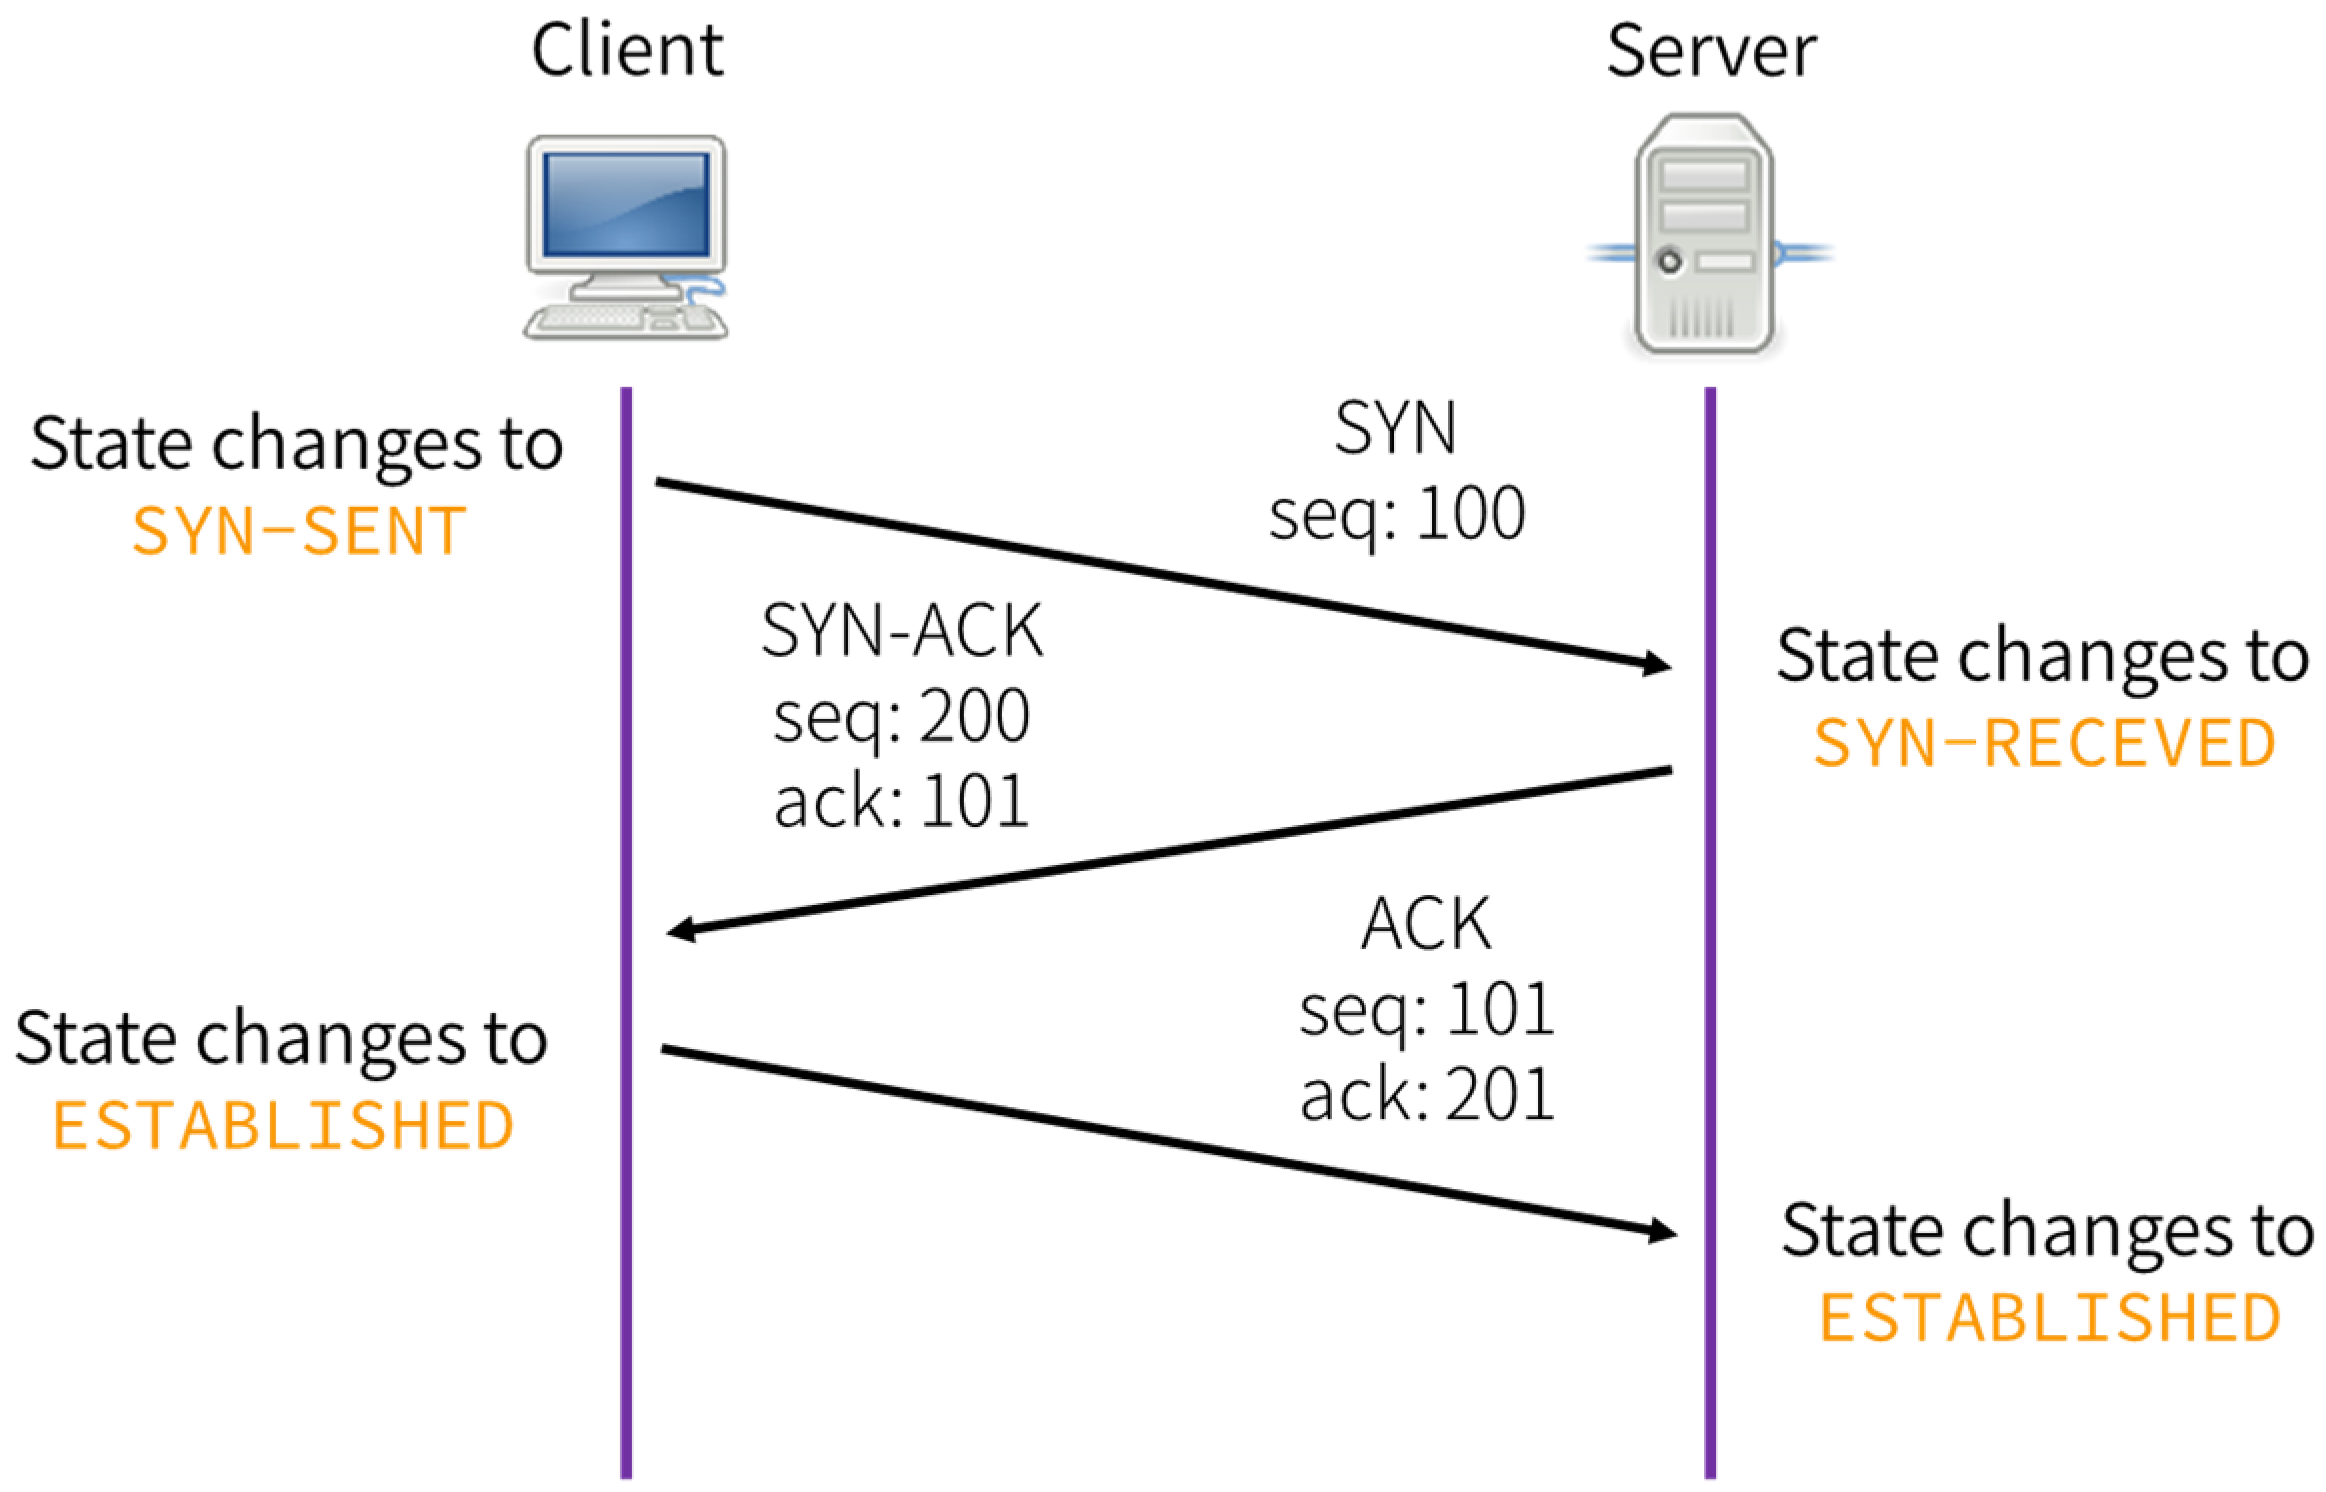
In order to check the TCP SYN/SYN-ACK handshake, I used netcat: One on the London server, used in listen mode, and the other on the Tokyo server, establishing connections. At the same time, I used tcpdump to capture the raw frames.
The London based server did show the SYN and SYN-ACK response packets.
#London > sudo tcpdump -c 10 ip6 host 2400:8902::f03c:.... -n
02:45:10.545147 IP6 2400:8902::f03c:.....54118 > 2a01:7e00::f03c:.....krb524: Flags [S], seq 1241850342, win 64800, options [mss 1440,sackOK,TS val 3582020984 ecr 0,nop,wscale 7], length 0
02:45:10.545222 IP6 2a01:7e00::f03c:.....krb524 > 2400:8902::f03c:.....54118: Flags [S.], seq 4136409442, ack 1241850343, win 64260, options [mss 1440,sackOK,TS val 4039886398 ecr 3582020984,nop,wscale 7], length 0
While the Tokyo based server did not show any of the SYN-ACK response.
#Tokyo> sudo tcpdump -c 10 ip6 host 2a01:7e00::f03c:....
11:45:10.418211 IP6 2400:8902::f03c:.....54118 > 2a01:7e00::f03c:.....krb524: Flags [S], seq 1241850342, win 64800, options [mss 1440,sackOK,TS val 3582020984 ecr 0,nop,wscale 7], length 0
11:45:11.434915 IP6 2400:8902::f03c:.....54118 > 2a01:7e00::f03c:.....krb524: Flags [S], seq 1241850342, win 64800, options [mss 1440,sackOK,TS val 3582022001 ecr 0,nop,wscale 7], length 0
This meant that the London server did properly receive the traffic, and for some reason, this traffic would never get back to the London server. Since this only happened for TCP packets, the next question was wether the server in London could actually establish TCP connections with the server in Tokyo.
#London > mtr --tcp -r -c 10 2400:8902::f03c:...
Start: Sat Feb 26 04:27:05 2022
HOST: London                Loss%   Snt   Last   Avg  Best  Wrst StDev
  1.|-- 2a01:7e00::208:....  0.0%    10    1.1   1.3   1.1   2.0   0.0
  2.|-- 2a01:7e00:7777:20::1 0.0%    10    3.0   3.8   0.5  15.1   4.6
  3.|-- 2a01:7e00:7777:5::1  0.0%    10    0.5  16.1   0.5  74.5  30.8
  4.|-- 2600:3c04:15:5::2    0.0%    10   76.4  74.8  74.6  76.4   0.5
  5.|-- 2600:3c04:15:5::2    0.0%    10  130.3  97.0  74.6 130.4  28.7
  6.|-- 2600:3c01:3333:5::1  0.0%    10  130.6 131.6 130.3 138.4   2.4
  7.|-- 2001:678:34c:6c::2   0.0%    10  136.3 175.8 130.3 239.8  53.5
  8.|-- 2001:678:34c:6c::2   0.0%    10  236.5 236.8 236.4 237.5   0.0
  9.|-- 2400:8902::f03c:.... 0.0%    10  239.0 263.9 237.1 336.7  42.7
Unfortunately, the connection in that direction did work fine. If it had not, that could have indicated an issue with the router not properly forwarding packets, for instance because of a corrupted cache (as described in everflow). But no, that was not the case.
Layer 2 - Neighbour Connectivity
After scratching my head for a few more hours, I decided to reach out to the Linode team who suggested to flush the ARP cache using ip neigh flush all and checking the results using ip -6 neigh show.
At first glance, having to flush the ARP entries is somewhat a bit irrational in the context of this problem: ARP is only about resolving the next-hop mac address. So, if the traffic can get through UDP, that would mean that the next hop is was properly resolved. In that case, why couldn't the same next-hop work too with TCP?
I decided anyways to follow the suggestion from the Linode team, and, to my surprise, there was actually a lot of FAILED entries in the ARP table (FAILED indicates that the system could not be reached, while STALE indicates that the connection hasn't been recently verified):
#London > ip -6 neigh show
fe80::1 dev eth0 lladdr 00:05:xx:xx:xx:xx router REACHABLE
fe80::bace:f6ff:fexx:4aa6 dev eth0 lladdr b8:ce:xx:xx:xx:xx STALE
fe80::8678:acff:fexx:21cc dev eth0 lladdr 84:78:xx:xx:xx:xx router STALE
fe80::bace:f6ff:fexx:5a56 dev eth0  router FAILED
fe80::bace:f6ff:fexx:4b66 dev eth0  router FAILED
fe80::063f:72ff:fexx:5af2 dev eth0  FAILED
fe80::063f:72ff:fexx:53f2 dev eth0  FAILED
fe80::bace:f6ff:fexx:5ee6 dev eth0  FAILED
fe80::bace:f6ff:fexx:4a66 dev eth0  FAILED
Flushing did not fix anything. But checking the ARP table triggered the idea to alos check the ip routing table, and check if any of those failed IP could be in the routing table. The result, which can be obtained using ip -6 r came as a big surprise:
#London > ip -6 r
fe80::/64 dev eth0 proto kernel metric 100 pref medium
fe80::/64 dev eth0 proto kernel metric 256 pref medium
fe80::/64 dev tailscale0 proto kernel metric 256 pref medium
default proto ra metric 100
	nexthop via fe80::1 dev eth0 weight 1
	nexthop via fe80::4094 dev eth0 weight 1
	nexthop via fe80::063f:72ff:fexx:52f2 dev eth0 weight 1
	nexthop via fe80::bace:f6ff:fexx:4a66 dev eth0 weight 1
	nexthop via fe80::bace:f6ff:fexx:42c6 dev eth0 weight 1
	nexthop via fe80::bace:f6ff:fexx:5ee6 dev eth0 weight 1
	nexthop via fe80::bace:f6ff:fexx:42e6 dev eth0 weight 1
	nexthop via fe80::bace:f6ff:fexx:5a56 dev eth0 weight 1
	nexthop via fe80::063f:72ff:fexx:53f2 dev eth0 weight 1
	nexthop via fe80::bace:f6ff:fexx:4b66 dev eth0 weight 1
	...
There are many questions from the routing output. The first and most obvious is why is there so many IP listed as the next-hop? Usually VMs report only fe80::1 or fe80::4096 as the next hop, but not this specific server, which listed more than 30 next hop IPs for the same eth0 network interface.
Second question, why did most of those next hop IPs were actually those marked as failed in the ARP entries. The good news is that it could explain the issue with TCP and IPv6: Provided the IP routing kernel would "stick" the TCP flow (identified by a directional source-destination IP) to a given failed next-hop, that would explain why some flow would fail, but not other.
At this point, I still do not have the answers to the those two questions, and quick a google search did give any outstanding explanation. It seems that the only way is to dig into the kernel code, in a similar way as this excellent article on IPv6 routing performance. I will keep this for a later post.
Layer 1 - Physical Connectivity
Meanwhile, there is actually another much more relevant question: in a data-center, how many peers neighbours can a VM have? I was somewhat naïve, thinking that all the VM traffic would go through a single Router (VTEP).
To verify the assumption, I first ran tcpdump to extract the MAC address and sort them by frequency. The result came again as a big surprise:
 #London > sudo tcpdump -c 10000  -nnS -e | awk '{ print($2);print($4); }' | grep -v Flags | sed 's/,//g' | sort | uniq -c | sort -n
  10000 f2:3c:91:xx:xx:01
   9367 f2:3c:91:xx:xx:02
    307 00:00:0c:9f:f0:19
     51 00:05:73:a0:0f:ff
     ...
The first two address f2:3c:91:xx:xx:xx are mac addresses of VMs hosted in the London data-center. Having direct VM L2 connectivity is ok provided that VxLAN is used, which ought to be the case (it is actually quite difficult to find any information from Linode DC topology).
What is interesting are the other IP addresses. Could they be from different VTEPs, which seems to be a recommended load-balancing design? To know the answer, the traffic needs to be classified by mac and IP flows. I implemented a simple golang app (gist) to classify the packets, and here is the result:
| IP | MAC |
|---|---|
| ipv4-public-linode-tokyo-1 | >00:00:0c:9f:f0:19 |
| ipv4-public-linode-tokyo-2 | >00:00:0c:9f:f0:19 |
| ipv4-public-linode-london-2 | >00:00:0c:9f:f0:19 |
| ipv6-public-linode-tokyo-2 | >00:05:73:a0:0f:ff |
| ipv6-public-linode-tokyo-1 | >00:05:73:a0:0f:ff >00:05:73:a0:0f:fe |
| ipv6-public-digitalocean-uk | >00:05:73:a0:0f:ff |
| ipv6-public-digitalocean-de | >00:05:73:a0:0f:fe |
| ipv4-private-linode-london-2 | >f2:3c:91:37:xx:xx |
| ipv4-private-linode-london-3 | >f2:3c:91:a1:xx:xx |
| ipv4-private-linode-london-1 | >f2:3c:92:a1:xx:xx |
It shows that all private IP address are using their own Mac address, which is the expected behaviour for VxLAN. It also shows that IPv6 and IPv4 are using different next-hop, which is not a problem in itself. And finally, it shows that the connection to Tokyo-1 server is using two next-hops MAC addresses, which, at first glance, seems suspicious.
A TCP-dump helped to confirm that the two next-hops seems to be distributed among packets based on the flow label.
Packet 1 & 2, using flow label
774398:
- Layer 1 (14 bytes) = SrcMAC=f2:3c:91:..:..:.. DstMAC=00:05:73:a0:0f:fe EthernetType=IPv6 Length=0}
- Layer 2 (40 bytes) = IPv6	FlowLabel=774398 Length=32 NextHeader=TCP HopLimit=64 SrcIP=2a01:7e00::f03c:... DstIP=2400:8902::f03c:...

- Layer 1 (14 bytes) = SrcMAC=f2:3c:91:..:..:.. DstMAC=00:05:73:a0:0f:fe EthernetType=IPv6 Length=0}
- Layer 2 (40 bytes) = IPv6	FlowLabel=774398 Length=32 NextHeader=TCP HopLimit=64 SrcIP=2a01:7e00::f03c:... DstIP=2400:8902::f03c:...
Packet 3&4, using flow label
106397
- Layer 1 (14 bytes) = SrcMAC=f2:3c:91:..:..:.. DstMAC=00:05:73:a0:0f:ff EthernetType=IPv6 Length=0}
- Layer 2 (40 bytes) = IPv6	FlowLabel=106397 Length=32 NextHeader=TCP HopLimit=64 SrcIP=2a01:7e00::f03c:... DstIP=2400:8902::f03c:...

- Layer 1 (14 bytes) = SrcMAC=f2:3c:91:..:..:.. DstMAC=00:05:73:a0:0f:ff EthernetType=IPv6 Length=0}
- Layer 2 (40 bytes) = IPv6	FlowLabel=106397 Length=394 NextHeader=TCP HopLimit=64 SrcIP=2a01:7e00::f03c:... DstIP=2400:8902::f03c:...
To understand the reason for those two hops, we need to get back to the ARP entries. Here is what ip -6 neigh show shows for the two MAC addresses:
| IP | dev | lladr | State |
|---|---|---|---|
| fe80::4094 | eth0 | 00:05:73:a0:0f:fe |
router REACHABLE |
| fe80::1 | eth0 | 00:05:73:a0:0f:ff |
router REACHABLE |
The two IPs are both link-local IPv6 addresses, and fe80::1 is the default IPv6 gateway, while fe80::4094 is actually a random link local address. Considering that the two mac address differ only by 1 bit, it should be ok to assume that they come from the same network device having two MAC addresses, maybe used in LAG mode. In any case, since those two macs are valid and reachable next-hops, it is totally acceptable for the Kernel to use any of those for IP routing.
The more interesting question is why does this only happen for a single remote VM, which, coincidentally, is also located in the Tokyo data-centre. To answer this question, I will need to deep dive into the Linux kernel, with the hint that it has something to do with flow-label. I will keep this for a later post.
For now, this multi next-hop routing behaviour is maybe not a bad news, because it could definitely explain the reason why the IPv6 connectivity got initially lost from the two VM in London and Tokyo.
Conclusion
I would have liked to be able to do even more post-mortem analysis, but unfortunately, the failing server in London got an automated upgrade to migrate the external disk from SSD to NVMe, which required a reboot.
The somewhat good news is that the problem got fixed after the reboot. Yet, in terms of devops, that is not a good news, because having to reboot a server should always remain an exceptional situation. But given that the issue seems to have been caused by an IPv6 routing corruption, and that flushing the ARP entries did not solve the issue, there was not much alternative left but reboot.
Going forward, there is one thing to remember when handling connectivity issue: always check the IP routing table! This should actually be automated and periodically checked by monitoring tools.